The Clarkdale Experiment: Mea Culpa
by Loyd Case on May 4, 2010 1:57 PM ESTThe Game is Afoot
I ran a number of games, plus one synthetic benchmark. All tests were run at two different resolutions and detail settings: 1440x900, low graphics settings, and 1920x1080 at fairly high settings. The first, low resolution set of tests represent performance weighted towards the CPU, and are not graphics bound. The second set of tests represent playable resolutions and detail settings, and can be graphics bound in some cases.
· Unigine Heaven (synthetic). The 1440x900 benchmark was run in DX10 mode, the 1920x1080 benchmark run in DX11 mode, with hardware tessellation enabled.
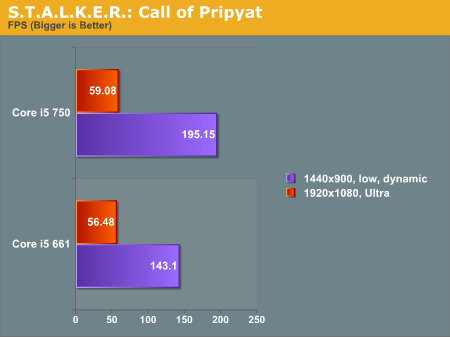
· S.T.A.L.K.E.R.: Call of Pripyat. The lower resolution test was run with the low detail, dynamic presets. The 1080p benchmark was run in DX11 mode, high preset, with hardware tessellation enabled.
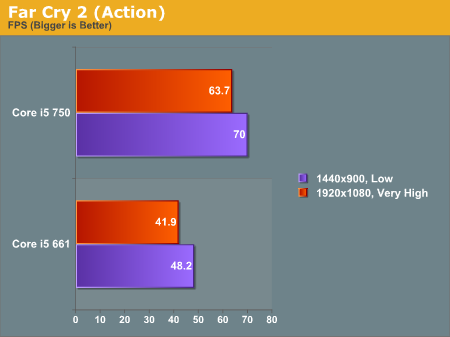
· Far Cry 2: Action benchmark. This is one of the included scenarios with the Far Cry 2 benchmark tool, and is pretty CPU intensive – but also represents the game’s more combat-intensive scenes. The low preset was used for the 1440x900 test, the high preset (DX10 enabled) with the higher resolution test.
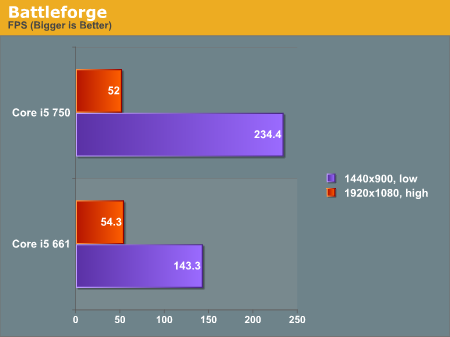
· Battle Forge. This RTS is CPU intensive, but also implements DX11 graphics in the highest detail modes.
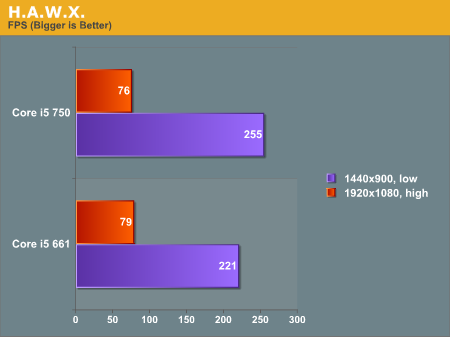
· Tom Clancy’s H.A.W.X. This title is an arcade styleflight sim, with lots of DX10 eye candy.
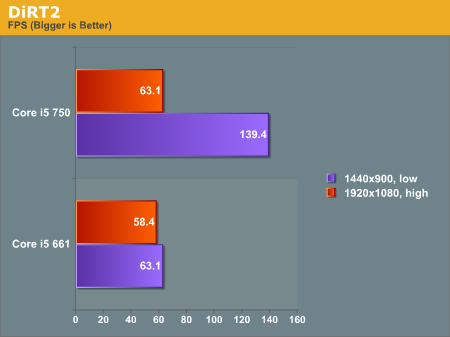
· DiRT2 (Demo): This rally racing title supports DX11 and DX9, but not DX10.
Let’s take a look at the results.
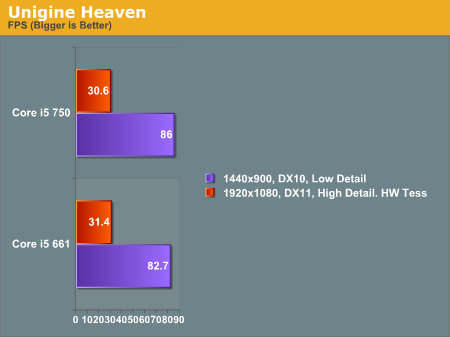
When we keep the resolution and detil levels low (tessellation is off in the low resolution test), the CPU differences are noticeable. Once we dial up the graphics pain, though, the difference is negligible.
Heaven is a synthetic test that pushes certain DX11 features. Let’s see how real games fare.
There are some intriguing tidbits in the data. Some of them are a little head-scratching.
Remember, if we run a game at low resolution, with detail levels dialed down, then the game is more likely to be CPU bound than graphics bound. In other words, the CPU impact is exaggerated. If we just look at the low detail results, we see clear wins across the board for Lynnfield. Clearly, if we only ever play games on small displays with crappy visuals, Lynnfield wins out.
The head-scratching part comes in when we dial up the graphics pain. In theory, as you dial up resolution and detail levels, the graphics hardware plays a bigger role, and differences in CPU performance become less noticeable. That’s not true with radical differences in CPU – a slow Celeron compared to a fast Core i7 would run games much more slowly, no matter what GPU is installed. Still, with somewhat similar classes of processors, you’d expect minimal differences.
What we see here, though is a mixed bag. The Far Cry 2 Action scene, for example, still demonstrates a noticeable performance edge for Lynnfield, while we see small, but not insignificant, differences in favor of Clarkdale on Battle Forge and HAWX. Still, the overall edge lies in favor of Lynnfield, with the slower clocked quad core CPU winning in Far Cry 2, DiRT2 and STALKER. These results are pretty much repeatable with multiple runs, too. The numbers vary slightly, but the pattern doesn’t change.


45 Comments
View All Comments
GeorgeH - Tuesday, May 4, 2010 - link
It’s nice to see you test these systems, but the numbers and analysis you present are completely useless; here are two reasons why:Unigine:
From the article: “When we keep the resolution and detil levels low (tessellation is off in the low resolution test), the CPU differences are noticeable. Once we dial up the graphics pain, though, the difference is negligible.” At both resolutions the difference is about 3%; how can 3% be both noticeable and negligible at the same time?
S.T.A.L.K.E.R.:
How repeatable is 195.15 FPS – can you really report 5 significant figures here? From the article: “The numbers vary slightly, but the pattern doesn’t change.” Varying numbers are incredibly important to establishing the relevance of a pattern; for all I know 195.15 is a high outlier and 143.1 is a low outlier. You might be reporting the mean of multiple runs with significant figures appropriate to their standard deviation, but the overall impression of the article is that you ran the benches once and reported whatever number got spit out, with verification that it indeed should have been “bigger” or “smaller” than the number spit out by the other system by running the benchmarks again.
Combining those two problems, I’m forced to conclude that any numbers and analysis you report here are worthless. That’s unfortunate because they probably aren’t, it’s just the style of the report and failure to indicate more clearly what your testing methodology is that unfairly gives that impression.
tno - Tuesday, May 4, 2010 - link
I agree, completely, and this brings me to the biggest worry I've had over the content on AT for the last year or so. When it was Gary and Anand, there were some hiccups, either with style or content in many of the early articles. But before too long they both got very good at what they do and the result was for a while though throughput wasn't high it was of high quality, consistently. As the staff has grown, however, some of the new blood is really good at analysis and great create models for comparing various pieces of technology but don't write very well. Other staff members, Loyd inclusive, seem to have a great grasp of style and even their analysis sounds good, yet clearly here there are some content errors that lessen the impact of the piece.Anand, you have become a master at providing excellent content with impeccable style. Your new writers are all capable, but I think it might be time for a little writing and statistical analysis boot camp.
tno
dfonseca - Tuesday, May 4, 2010 - link
Seconded.This article by Loyd is a great example of this problem. It is well-worded and pleasant to read, but entirely inconsistent with other AT articles - with the exception of those written by Loyd.
Articles with this kind of content (hardware configuration benchmarking) abound in AT, and they roughly follow the same pattern with regards to what data is gathered, how it's presented, chart formatting, etc. Reading AT would be a better experience if the articles followed on that formula, or improved on it (with a strong focus on continuity).
futrtrubl - Tuesday, May 4, 2010 - link
Speaking of charts I think he grouped his bars badly. He's comparing systems so he should group by test/setting not by CPU so it's easier to compare.Also, he is inconsistent in referring to the chips, sometimes by model number and sometimes by codename. I don't know which is which and while I can look it up I shouldn't have to translate it in my head every time they are mentioned.
anactoraaron - Tuesday, May 4, 2010 - link
But the biggest thing with these numbers is the HDD difference. Having a 250gb SSD vs anything other than another SSD will throw these numbers off... Putting in a SSD for the i5-750 will likely add ~10% more to all numbers across the board for it. I just can't help but think how much better the i5 750 would have been with a SSD. Anand himself no longer does any benchmarking amongst cpu's now without a SSD since it takes away variables a platter HDD may cause.I second the boot camp idea.
alphacheez - Tuesday, May 4, 2010 - link
This shows that the i5-750 seems to have more room to grow as demands will increase in the future.The 750 should be able to keep up with the next generation of games while the 661 might run out of steam and leave you CPU-bound.
I think the colors on the Cinebench and video encoding graphs are/were backwards. The higher Cinebench score should correspond with the multi-CPU test and I'd expect the 1080p wmv to h.264 encode to take longer than the avi to mp4 (iPod) encode.
I'd be interested to hear others experience with Clarkdale-based HTPCs as far as video playback, encoding, power usage, and noise.
The systems examined in this write-up are pretty high-powered compared to what might be in a typical HTPC. A Radeon 5770 should be enough to power games at 1920x1080 (HDTV) resolutions and really put the kibosh on power usage.
jasperjones - Wednesday, May 5, 2010 - link
agreed, the legend in cinebench seems incorrect.Jaguar36 - Tuesday, May 4, 2010 - link
Could you check the power usage without the Radeon in the system? Since I leave my PC on 24/7 I really want to know how much power the card uses at idle compared to the IG.justinegg - Tuesday, May 4, 2010 - link
How much of a difference could PCI-Express and other chipset bottlenecks affected these gaming benchmarks?Would the i5 -750's numbers be closer to the 661's if it were in the H55 board?
jonup - Tuesday, May 4, 2010 - link
I am not an expert, but per my discussions with several reviewers H55 performance is similar if not identical to P55.As for the performance difference between 750 and 661, it could be due to the memory latencies on top of the L3 size.