The Armari Magnetar X64T Workstation OC Review: 128 Threads at 4.0 GHz, Sustained!
by Dr. Ian Cutress on September 9, 2020 12:00 PM EST- Posted in
- Desktop
- Systems
- AMD
- OC Systems
- ThreadRipper
- 3990X
- Armari
- Magnetar
- X64T
- Rendering
Rendering Benchmark Performance
On the AnandTech benchmark side of the equation, if you read the recent article on our #CPUOverload project, we detail the 150 or so tests in our new testing suite that we aim to perform on as many CPUs as possible. These tests are designed for a wide range of systems, from highly responsive systems for user access, low powered devices, gaming machines, workstations, and the enterprise market, with a variation to cover a wide range of markets. All of our results will be published in our benchmark database, Bench, and the key ones that form the focus of the Magnetar are compared on this page.
The Magnetar X64T is a workstation through and through, with a focus on rendering, simulation, and hard core math. We’ve currently tested our new benchmark suite on around 20 processors, and out of these we have the following comparison points:
| AnandTech Test Systems | ||
| AnandTech | Cores | DRAM |
| Armari Magnetar X64T | 64C / 128T | 4 Ch DDR4-3200 C20 |
| TR3 3990X | 64C / 128T | 4 Ch DDR4-3200 C15 |
| Xeon W-3175X | 28C / 56T | 6 Ch DDR4-2666 C20 |
| Xeon Gold 6258R | 28C / 56T | 6 Ch DDR-2933 C21 |
The key win here for the Magnetar X64T is going to be multithreaded performance, where it hits 3.9-4.1 GHz all-core sustained depending on the test.
The key things to note here are between the Magnetar X64T and our stock 3990X. This system typically ships with DDR4-3866 C18, however due to a last minute system rebuild before the system was shipped, a coolant accident meant that for stability, the memory was replaced. As a result, we’re going to see some circumstances where the faster memory of the stock 3990X will in out: in our peak bandwidth test, the X64T scored 81 GB/s, and our 3990X scored 85 GB/s. The four-channel Threadripper also has a bandwidth deficit to the six-channel Xeons, which is noticeable in a couple of tests. However, the tests where the Magnetar wins, it’s usually by a lot, as shown in the previous page.
Out of these CPUs, nothing else we’ve tested since our new benchmark suite started comes close. I think the key product we’re missing here is a 64-core EPYC or Threadripper Pro, which we’re hoping to receive soon.
Here are our rendering benchmark results.
Blender 2.83 LTS: Link
One of the popular tools for rendering is Blender, with it being a public open source project that anyone in the animation industry can get involved in. This extends to conferences, use in films and VR, with a dedicated Blender Institute, and everything you might expect from a professional software package (except perhaps a professional grade support package). With it being open-source, studios can customize it in as many ways as they need to get the results they require. It ends up being a big optimization target for both Intel and AMD in this regard.
For benchmarking purposes, Blender offers a benchmark suite of tests: six tests varying in complexity and difficulty for any system of CPUs and GPUs to render up to several hours compute time, even on GPUs commonly associated with rendering tools. Unfortunately what was pushed to the community wasn’t friendly for automation purposes, with there being no command line, no way to isolate one of the tests, and no way to get the data out in a sufficient manner.
To that end, we fell back to one rendering a frame from a detailed project. Most reviews, as we have done in the past, focus on one of the classic Blender renders, known as BMW_27. It can take anywhere from a few minutes to almost an hour on a regular system. However now that Blender has moved onto a Long Term Support model (LTS) with the latest 2.83 release, we decided to go for something different.

We use this scene, called PartyTug at 6AM by Ian Hubert, which is the official image of Blender 2.83. It is 44.3 MB in size, and uses some of the more modern compute properties of Blender. As it is more complex than the BMW scene, but uses different aspects of the compute model, time to process is roughly similar to before. We loop the scene for 10 minutes, taking the average time of the completions taken. Blender offers a command-line tool for batch commands, and we redirect the output into a text file.
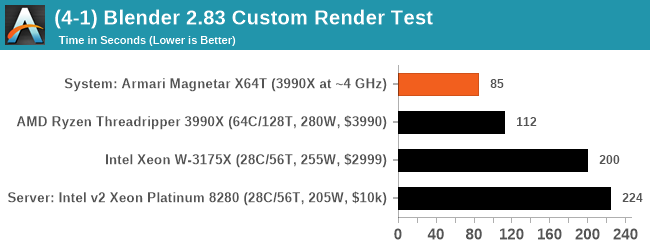
Over the standard Threadripper system, the X64T is around 32% faster in our Blender scene.
Corona 1.3: Link
Corona is billed as a popular high-performance photorealistic rendering engine for 3ds Max, with development for Cinema 4D support as well. In order to promote the software, the developers produced a downloadable benchmark on the 1.3 version of the software, with a ray-traced scene involving a military vehicle and a lot of foliage. The software does multiple passes, calculating the scene, geometry, preconditioning and rendering, with performance measured in the time to finish the benchmark (the official metric used on their website) or in rays per second (the metric we use to offer a more linear scale).
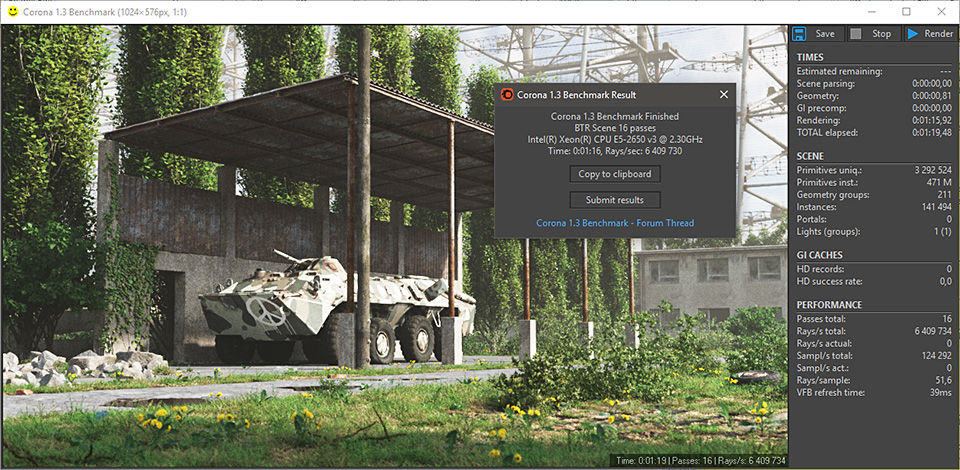
The standard benchmark provided by Corona is interface driven: the scene is calculated and displayed in front of the user, with the ability to upload the result to their online database. We got in contact with the developers, who provided us with a non-interface version that allowed for command-line entry and retrieval of the results very easily. We loop around the benchmark five times, waiting 60 seconds between each, and taking an overall average. The time to run this benchmark can be around 10 minutes on a Core i9, up to over an hour on a quad-core 2014 AMD processor or dual-core Pentium.
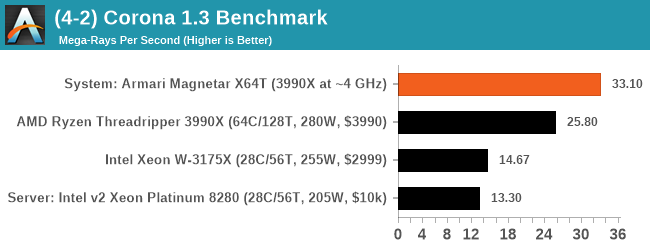
Corona typically scales very well with core count and frequency, and here the X64T has a 28% lead over a stock 3990X.
V-Ray: Link
We have a couple of renderers and ray tracers in our suite already, however V-Ray’s benchmark came through for a requested benchmark enough for us to roll it into our suite. Built by ChaosGroup, V-Ray is a 3D rendering package compatible with a number of popular commercial imaging applications, such as 3ds Max, Maya, Undreal, Cinema 4D, and Blender.
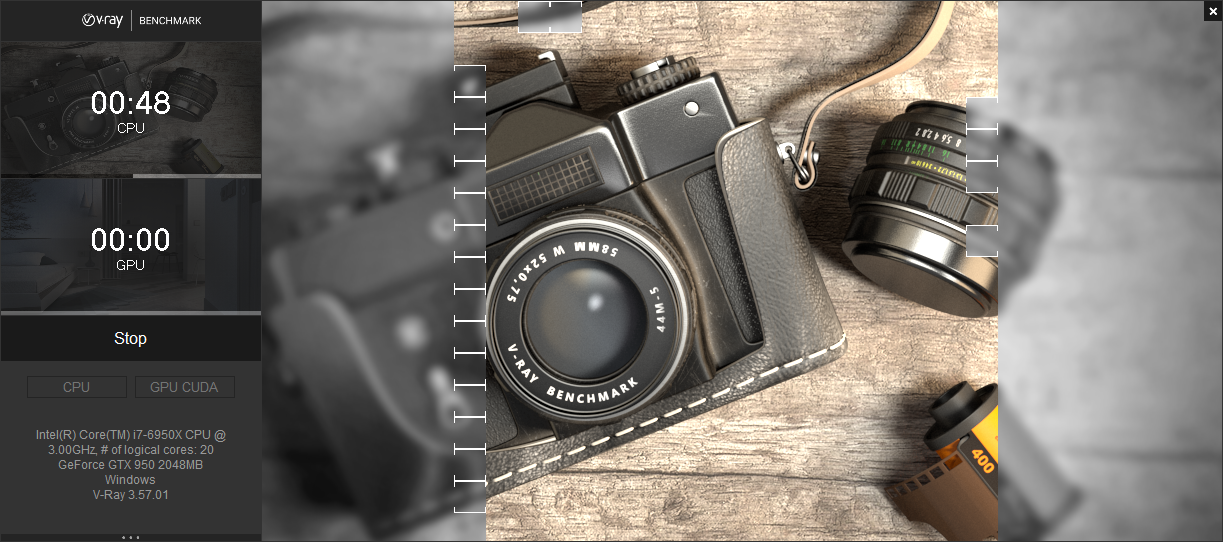
We run the standard standalone benchmark application, but in an automated fashion to pull out the result in the form of kilosamples/second. We run the test six times and take an average of the valid results.
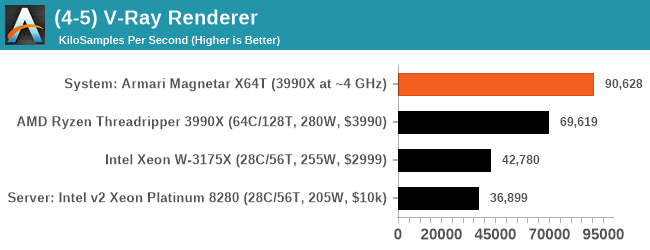
Similarly, the X64T has a 30% performance gain.
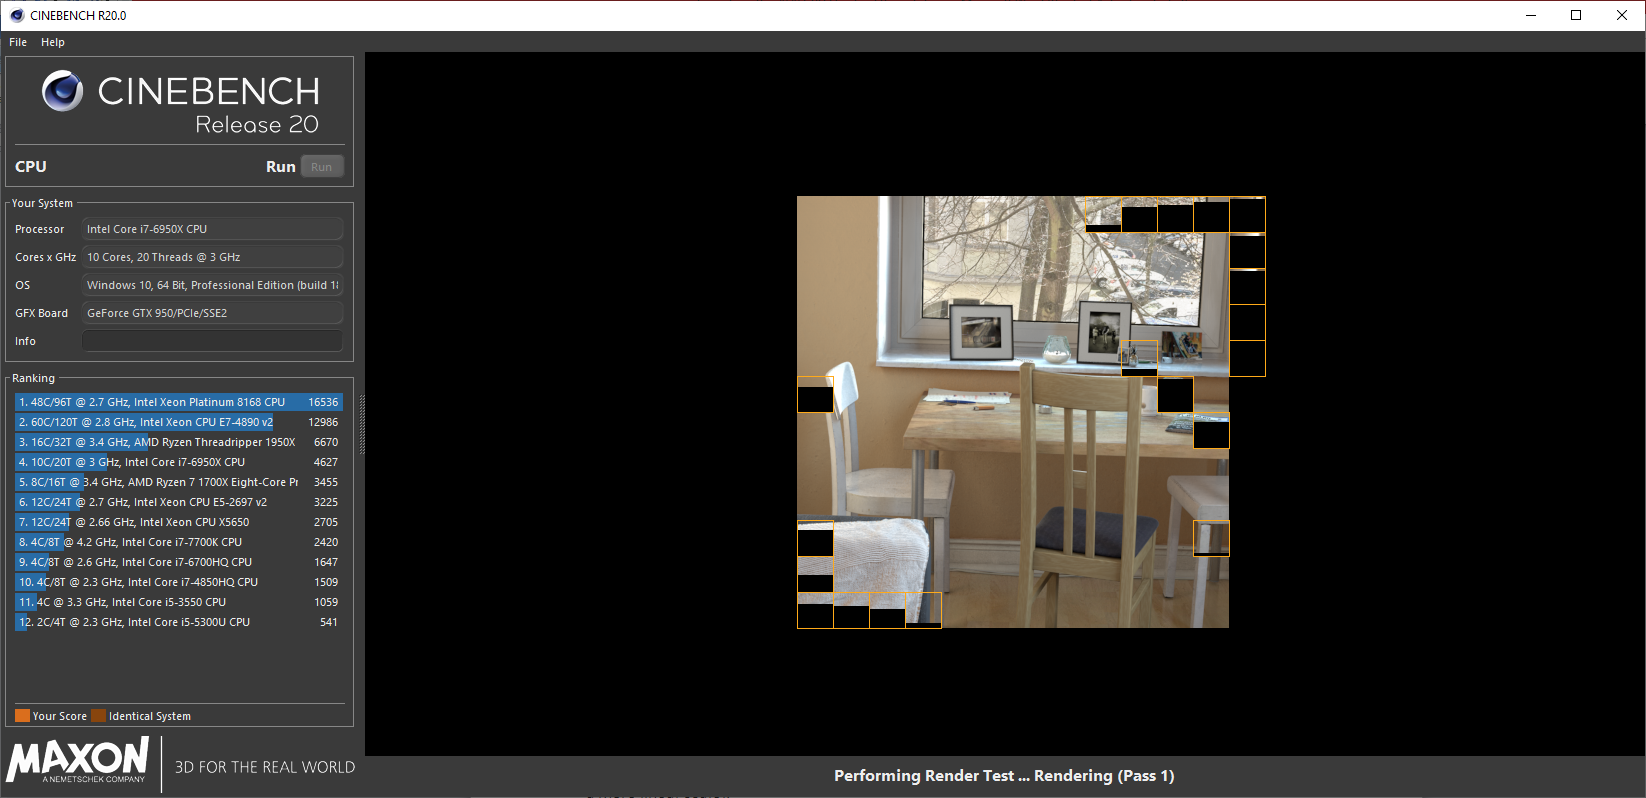
Cinebench R20: Link
Another common stable of a benchmark suite is Cinebench. Based on Cinema4D, Cinebench is a purpose built benchmark machine that renders a scene with both single and multi-threaded options. The scene is identical in both cases. The R20 version means that it targets Cinema 4D R20, a slightly older version of the software which is currently on version R21. Cinebench R20 was launched given that the R15 version had been out a long time, and despite the difference between the benchmark and the latest version of the software on which it is based, Cinebench results are often quoted a lot in marketing materials.
Results for Cinebench R20 are not comparable to R15 or older, because both the scene being used is different, but also the updates in the code bath. The results are output as a score from the software, which is directly proportional to the time taken. Using the benchmark flags for single CPU and multi-CPU workloads, we run the software from the command line which opens the test, runs it, and dumps the result into the console which is redirected to a text file. The test is repeated for 10 minutes for both ST and MT, and then the runs averaged.
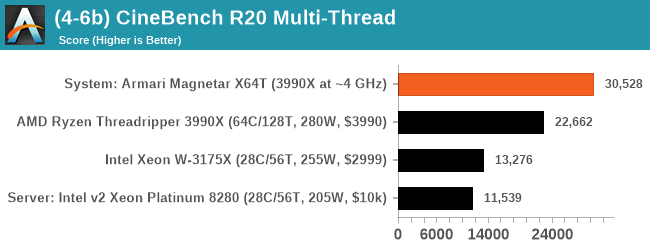
Cinebench go brrrr. I will never get tired of a quick R20 run like this, at around 15 seconds for the X64T. Performance is +35% over the stock 3990X.


96 Comments
View All Comments
WaltC - Wednesday, September 9, 2020 - link
Very impressive box!...;) Great write-up, too! Great job, Ian--your steady diet of metal & silicon is really producing obvious positive results! I would definitely want to go with a different motherboard, though. Even the GB x570 Aorus Master has received ECC ram support with the latest bios featuring the latest couple of AGESA's from AMD--so it seems like a shoe-in for a TR motherboard. I agree it's kind of an odd exclusion from AMD for TR. But, I suppose if you want ECC support and lots more ram support you'll need to step up to EPYC and its associated motherboards. This is a real pro-sumer offering and the price--well, everything about it--seems right on the money, imo. I really like the three-year warranty and the included service to change out coolant fluid every three years--very nice! If I used water cooling that is the only kind of fluid I would want to use--some of these el cheapo concoctions will eat up a radiator in a year or less! Enjoyed the article--thanks again...;)Makaveli - Wednesday, September 9, 2020 - link
"Ideally AMD would need a product that pairs the 8-channel + ECC support with a processor overclock."But why?
I maybe wrong here but when you are spending 10k+ on a build isn't stability more important than overclocking?
MenhirMike - Wednesday, September 9, 2020 - link
Overclocking doesn't have to be unstable - and for some workloads, the extra performance is worth the effort to find the limits and beef up the cooling solution.Ian Cutress - Thursday, September 10, 2020 - link
Had a chat with Armari. The system was built with the OC requirements in mind, and customized to support that. They're using a PBO-based overclock as well, and they've been really impressed with how AMD's latest variation of PBO can optimize the DVFS of the chip to keep the system stable regardless of workload (as long as heat is managed). In my testing, there was zero instability. I was told by Armari that they can build 10, 20, or 50 systems in a row without having any stability issues coming from the processor, and that binning the CPU is almost virtually non-existant.Everett F Sargent - Wednesday, September 9, 2020 - link
So, such a waste of power, time and money.Anyone can build TWO 3990X systems for less then half the price AND less then half the power consumption with each of them easily getting ~90% of the benchmarks.
That is with a top of the line titanium PSU, top of the line MB, top of the line 2TB SSD, top of the line Quadro RTX 4000 (oh damn paying 5X for the 6000 for only less then 2X the performance, what a b1tch, not), top of the line ... everything.
So ~1.8X of the total performance at ~1.8X the cost (sale pricing for all components otherwise make that ~1.9X the cost) and ~0.9X of the total power consumption.
But, you say, an ~15KUS system pays for itself, in less then 1E−44 seconds, even. Magnetarded indeed. /:
TallestGargoyle - Thursday, September 10, 2020 - link
That's a pretty disingenuous stance. Yes, you can split the performance across multiple systems, likely for cheaper, but that ignores general infrastructure requirements, like having multiple locations to set up a system in, having enough power outlets to run them all, being capable of splitting the workload across multiple systems.Not every workload can support distributed processing. Not every office has the space for a dedicated rack of systems churning away. Not every workload can sufficiently run on a half-performing GPU, even if the price is only a fifth of the one used here.
If your only metric is price-to-performance, then yes, this isn't the workstation for you. But this clearly isn't hitting a price-to-performance metric. It's focusing on the performance.
Tomatotech - Thursday, September 10, 2020 - link
Something something chickens and oxen.Or was it something something sports cars and 49-ton trucks? I’ll go yell at clouds instead.
Spunjji - Friday, September 11, 2020 - link
Perish the thought that someone might order one of these with a Quadro 4000 and obviate his biggest gripe (not that it would solve the potential problem of fitting a dataset into 8GB of RAM instead of 24GB)Everett F Sargent - Saturday, September 12, 2020 - link
Well there is that 20% VAT that pushes the actual system price to ~$17K US so dividing by two ~$8.5K per system minus the cost of a RTX 4000 at ~1K US gives one ~$6K US sans graphics card (remember I said build two systems with RTX 4000 at ~$7K US).So I have about ~$2.5K per system for a graphics card. Which easily gives one RTX 5000 per build at ~$2K US. Whiich is 2/3 of the RTX 6000.
But, if the GPU benchmarks are all eventually CPU bound, which appears to be the case here in this review, then yes I get two systems at ~$8K US or ~$16K US for two systems, in other words, I get to build a 3900X system for about ~$1K US to boot..
So no, I would rather see benchmarks at 4K, mind you (as these were at standard HD) with different GPU options. Basically, I would want to use my money wisely (assuming at a minimum a 3990X CPU at ~$4K US as the entry point).
Therefore, this review is totally useless to anyone interested in efficiency (which should normally include everyone) and costs (ditto).
TallestGargoyle - Monday, September 14, 2020 - link
That still doesn't take into account the issues I brought up initially with owning and running two systems.