Intel NUC10i7FNH Frost Canyon Review: Hexa-Core NUC Delivers a Mixed Bag
by Ganesh T S on March 2, 2020 9:00 AM ESTUL Benchmarks: PCMark and 3DMark
This section deals with a selection of the UL Futuremark benchmarks - PCMark 10, PCMark 8, and 3DMark. While the first two evaluate the system as a whole, 3DMark focuses on the graphics capabilities.
PCMark 10
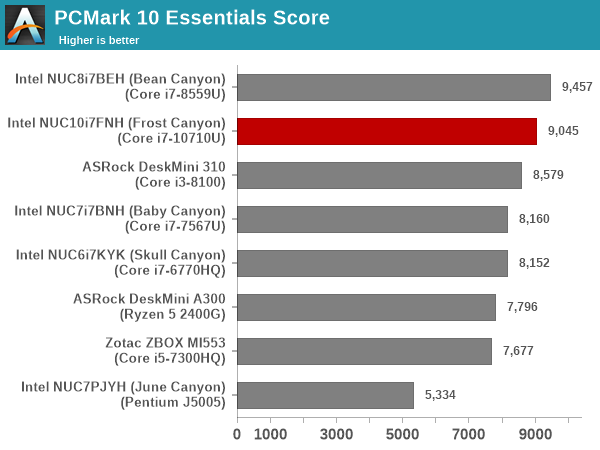
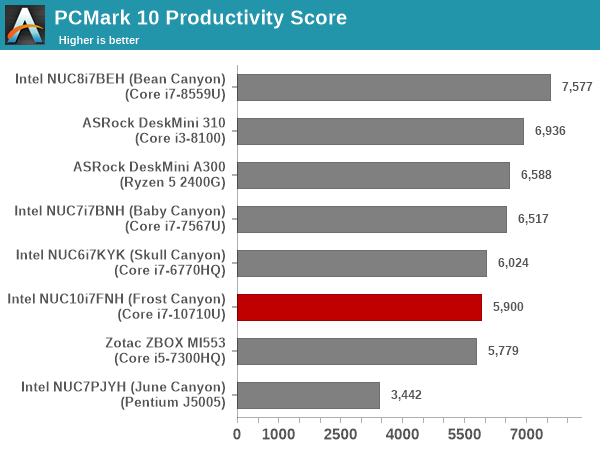
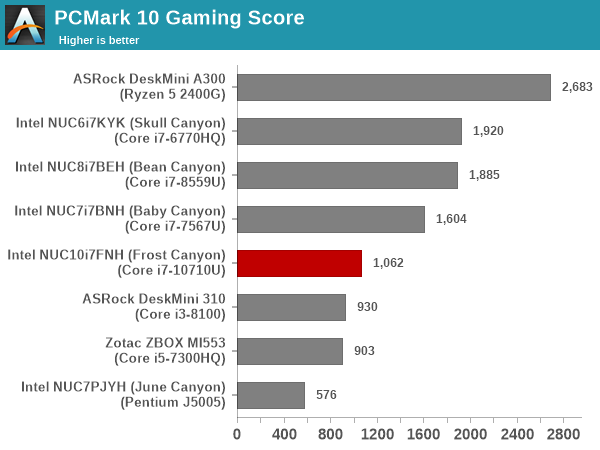
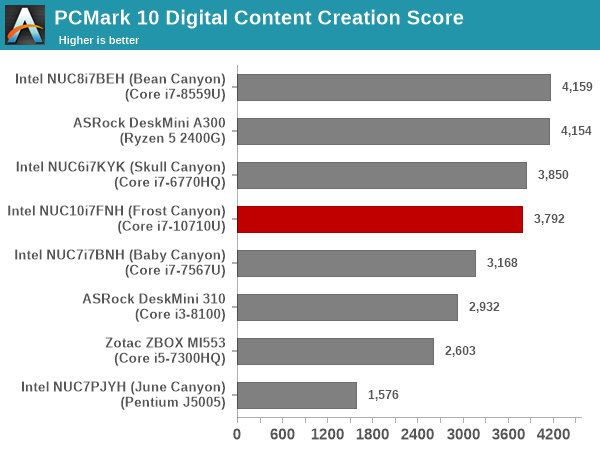
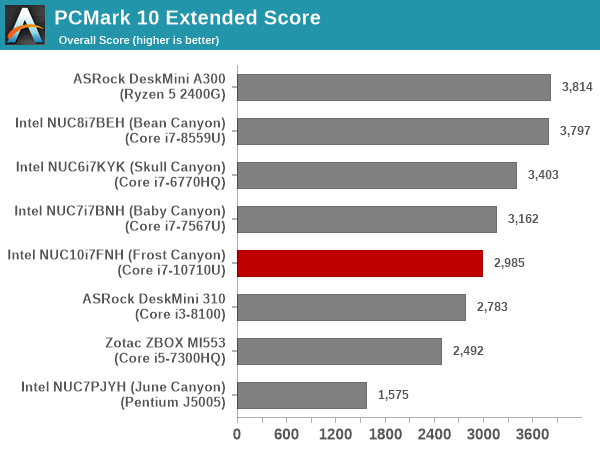
UL's PCMark 10 evaluates computing systems for various usage scenarios (generic / essential tasks such as web browsing and starting up applications, productivity tasks such as editing spreadsheets and documents, gaming, and digital content creation). We benchmarked select PCs with the PCMark 10 Extended profile and recorded the scores for various scenarios. These scores are heavily influenced by the CPU and GPU in the system, though the RAM and storage device also play a part. The power plan was set to Balanced for all the PCs while processing the PCMark 10 benchmark.
The Frost Canyon NUC comes in the middle of the pack, getting bettered by either systems with CPUs capable of higher TDP or better-performing storage. The hexa-core capabilities do not deliver any substantial benefits across various PCMark 10 scenarios, and the absence of Iris Plus Graphics / eDRAM pulls down the 'Gaming Score'.
PCMark 8
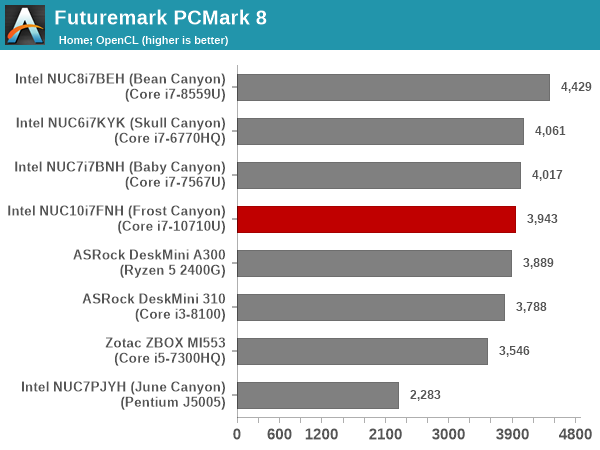
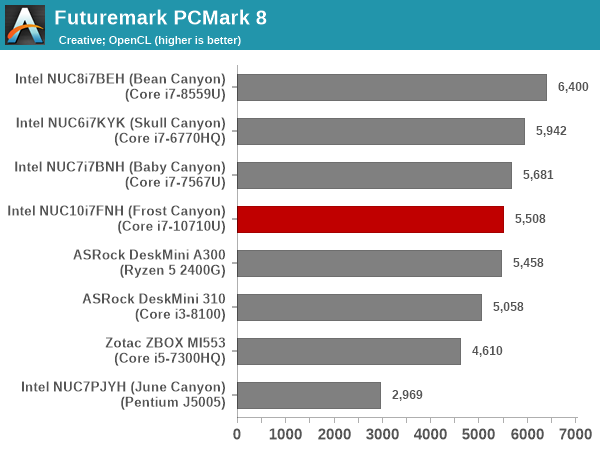
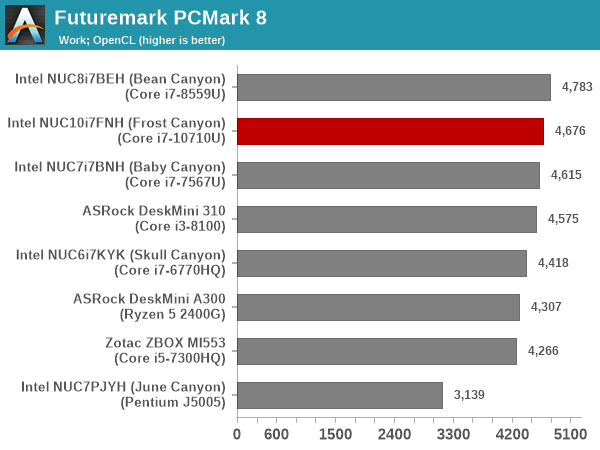
We continue to present PCMark 8 benchmark results (as those have more comparison points) while our PCMark 10 scores database for systems grows in size. PCMark 8 provides various usage scenarios (home, creative and work) and offers ways to benchmark both baseline (CPU-only) as well as OpenCL accelerated (CPU + GPU) performance. We benchmarked select PCs for the OpenCL accelerated performance in all three usage scenarios. These scores are heavily influenced by the CPU in the system, and the scores roughly track what was observed in the PCMark 10 workloads.
3DMark
UL's 3DMark comes with a diverse set of graphics workloads that target different Direct3D feature levels. Correspondingly, the rendering resolutions are also different. We use 3DMark 2.4.4264 to get an idea of the graphics capabilities of the system. In this section, we take a look at the performance of the Intel NUC10i7FNH (Frost Canyon) across the different 3DMark workloads.
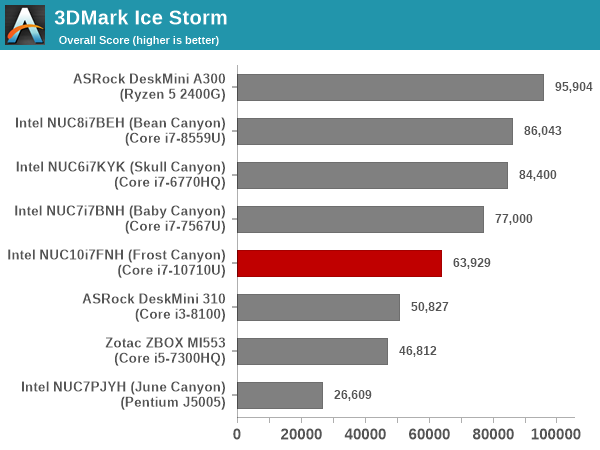
3DMark Ice Storm
This workload has three levels of varying complexity - the vanilla Ice Storm, Ice Storm Unlimited, and Ice Storm Extreme. It is a cross-platform benchmark (which means that the scores can be compared across different tablets and smartphones as well). All three use DirectX 11 (feature level 9) / OpenGL ES 2.0. While the Extreme renders at 1920 x 1080, the other two render at 1280 x 720. The graphs below present the various Ice Storm worloads' numbers for different systems that we have evaluated.
| UL 3DMark - Ice Storm Workloads | |||
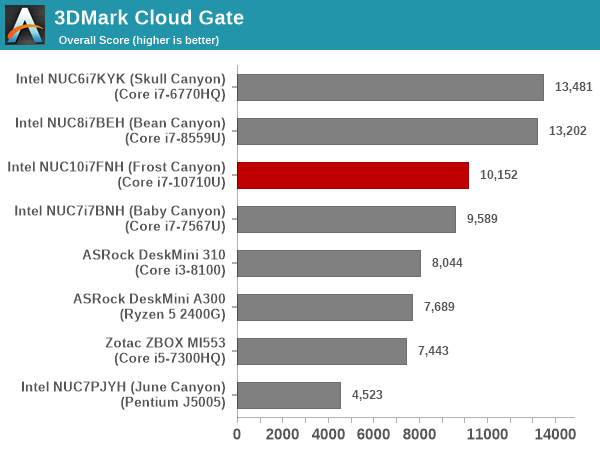
3DMark Cloud Gate
The Cloud Gate workload is meant for notebooks and typical home PCs, and uses DirectX 11 (feature level 10) to render frames at 1280 x 720. The graph below presents the overall score for the workload across all the systems that are being compared. The absence of eDRAM / Iris Plus Graphics results in the Frost Canyon performing significantly worse compared to the Bean Canyon.
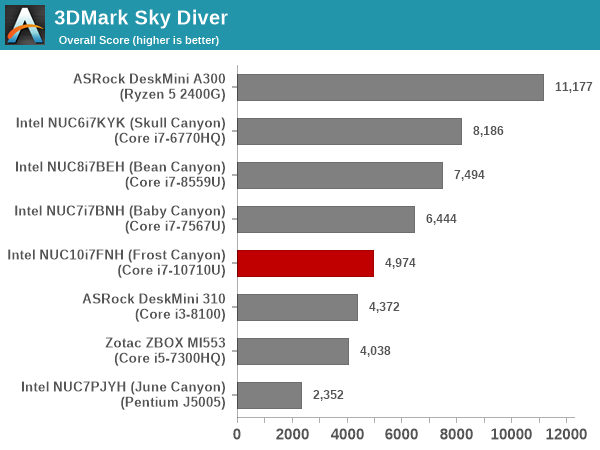
3DMark Sky Diver
The Sky Diver workload is meant for gaming notebooks and mid-range PCs, and uses DirectX 11 (feature level 11) to render frames at 1920 x 1080. The graph below presents the overall score for the workload across all the systems that are being compared. At 1080p, Frost Canyon falls further behind, and is below Baby Canyon's performance - pointing to the lack of GPU prowess.
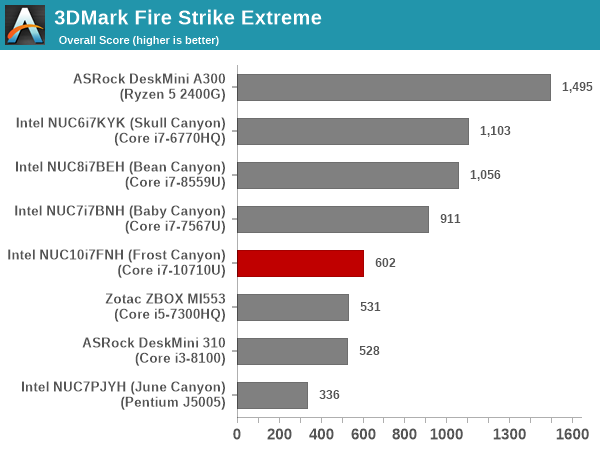
3DMark Fire Strike Extreme
The Fire Strike benchmark has three workloads. The base version is meant for high-performance gaming PCs. Similar to Sky Diver, it uses DirectX 11 (feature level 11) to render frames at 1920 x 1080. The Ultra version targets 4K gaming system, and renders at 3840 x 2160. However, we only deal with the Extreme version in our benchmarking - It renders at 2560 x 1440, and targets multi-GPU systems and overclocked PCs. The graph below presents the overall score for the Fire Strike Extreme benchmark across all the systems that are being compared. The results are similar to the Sky Diver workload.
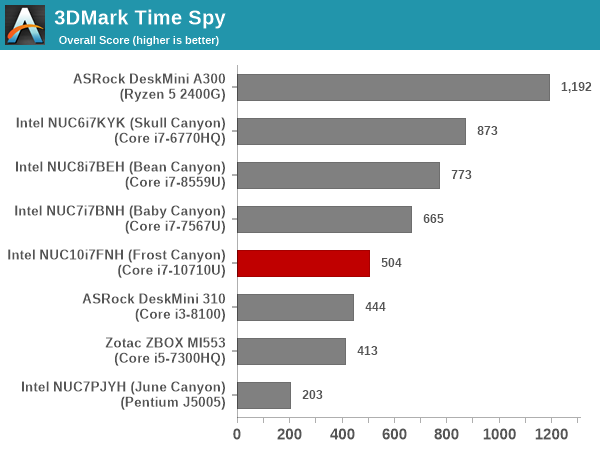
3DMark Time Spy
The Time Spy workload has two levels with different complexities. Both use DirectX 12 (feature level 11). However, the plain version targets high-performance gaming PCs with a 2560 x 1440 render resolution, while the Extreme version renders at 3840 x 2160 resolution. The graphs below present both numbers for all the systems that are being compared in this review, with results being similar to the 1080p Sky Diver workload.
| UL 3DMark - Time Spy Workloads | |||
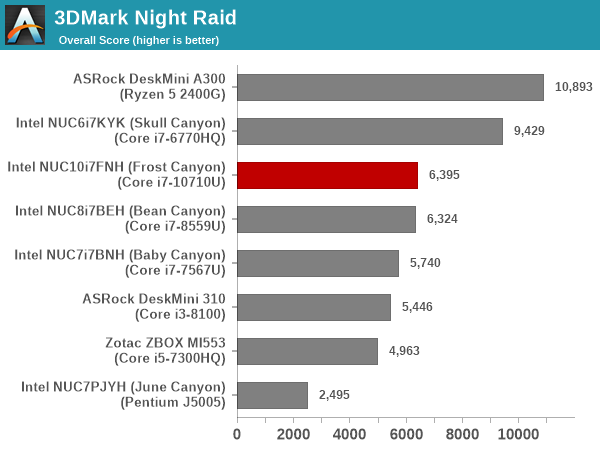
3DMark Night Raid
The Night Raid workload is a DirectX 12 benchmark test. It is less demanding than Time Spy, and is optimized for integrated graphics. The graph below presents the overall score in this workload for different system configurations.
Overall, for CPU-bound graphics workloads, the Frost Canyon performs well, but, in other cases, the absence of eDRAM and the need to share the TDP with a hexa-core CPU block shows its effects. In almost all cases, the Bean Canyon NUC either vastly overperforms the Frost Canyon NUC, or, is neck-to-neck with it.


85 Comments
View All Comments
The_Assimilator - Monday, March 2, 2020 - link
It's not, but the point is still valid: nobody buying these things is doing so because they expect them to be graphics powerhouses.HStewart - Monday, March 2, 2020 - link
But some people are so naive and don't realize the point. I came up in days when your purchase card that didn't even have GPU's on it. Not sure what level iGPU's are but they surely can run business graphics fine and even games a couple of years ago.notb - Thursday, March 5, 2020 - link
Horrible?These iGPUs can drive 3 screens with maybe 1-2W power draw. Show me another GPU that can do this.
This is an integrated GPU made for efficient 2D graphics. There's very little potential to make it any better.
PaulHoule - Monday, March 2, 2020 - link
Well, Intel's horrible iGPUs forced Microsoft to walk back the graphical complexity of Windows XP. They kept the GPU dependent architecture, but had to downgrade to "worse than cell phone" visual quality because Intel kneecaped the graphics performance of the x86 platform. (Maybe you could get something better, but developers can't expect you to have it)HStewart - Monday, March 2, 2020 - link
I think we need actual proof on these bias statements. I think there is big difference of running a screen at 27 or more inches than 6 to 8 inches no matter what the resolution.Korguz - Monday, March 2, 2020 - link
we need proof of your bias statements, but yet, you very rarely provide any.. point is ??Samus - Monday, March 2, 2020 - link
What does screen size have to do with anything? Intel can't make an iGPU that can drive a 4K panel fluidly, meanwhile mainstream Qualcomm SoC's have GPU performance able to drive 4K panels using a watt of power.HStewart - Tuesday, March 3, 2020 - link
Can Qualcomm actually drive say a 32 in 4k screen efficiently. Also what is being measure here, Videos or actually games and that depends on how they are written.erple2 - Saturday, March 14, 2020 - link
I'm not sure that I understand your statement here, as it doesn't seem to make any sense. I was not aware that they physical dimensions of the screen mattered at all to the GPU, apart from how many pixels it has to individually manage/draw. If your implication is the complexity and quantity of information that can be made significant on a 32" screen is different from a 5.7" screen, then I suppose you can make that argument. However, I have to make guesses as to what you meant for this to come to that conclusion.Generally the graphical load to display 4k resolution is independent of whether the actual screen is 6" or 100". Unless I'm mistaken?
PeachNCream - Monday, March 2, 2020 - link
For once, I agree with HStewart (feels like I've been shot into the Twilight Zone to even type that). To the point though, Windows XP was released in 2001. Phones in that time period were still using black and white LCD displays. Intel's graphics processors in that time period were the Intel Extreme series built into the motherboard chipset (where they would remain until around 2010, after the release of WIndows 7). Sure those video processors are slow compared to modern cell phones, but nothing a phone could do when XP was in development was anything close to what a bottom-feeder graphics processor could handle. I mean crap, Doom ran (poorly) on a 386 with minimal video hardware and that was in the early 1990s whereas phones eight years later still didn't have color screens.